Blog Ruby 4.0 upgrade: faster, but more memory growth
Upgrading to Ruby 4.0 (from 3.3) made the updown.io Sidekiq workers 15% faster in my benchmark (yay 🎉) but one day after deploying it, my servers started running low on memory. Here's how I tracked it down to a change in the Ruby 4.0 garbage collector, and the "fix".
In 2024 I upgraded from Ruby 3.1 to 3.3 (after some weird results) and the results in production were great. Two years later, it was time for the next big jump.
1. The upgrade
The upgrade itself was pretty smooth (still with jemalloc and YJIT of course). The test suite only needed a few minor changes, most of them coming from 3.4 actually as I skipped it:
- Error messages now use a simple quote instead of a backtick:
undefined method 'foo'instead ofundefined method `foo', and I had a few specs matching on them. - String literals are now "chilled": mutating them prints a deprecation warning as they will be frozen by default in the future, so a few
""becameString.new.
The benchmark looked good, so I deployed Ruby 4.0.9 in staging on November 15th and in production on the 16th.
2. The memory alert
The day after, my monitoring warned me that my servers were running low on memory. The Sidekiq workers memory kept climbing for longer than usual. Here's the memory used by the 9 monitoring servers over the last two weeks:
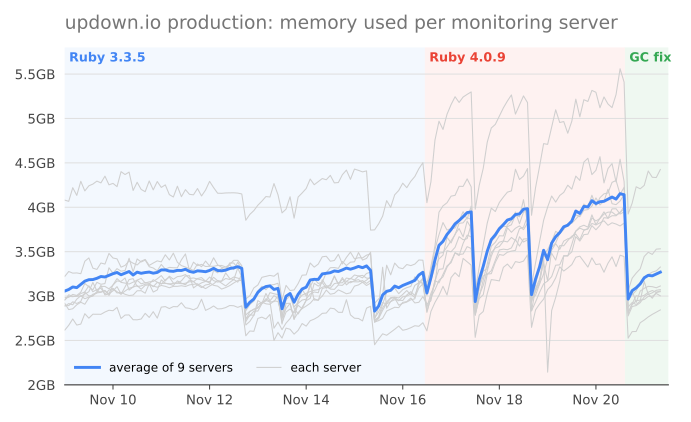
With Ruby 3.3 (blue), memory grows a bit after each restart and then stays flat for days. With Ruby 4.0 (red), it keeps growing by about 1.4GB in two days on each server, and the only thing keeping it low were my deploys 😅 the growth was not linera, so not sure if it's a leak or fragmentation at this point.
3. Reproducing it (and fixing my benchmark first) 🔬
So why didn't my benchmark catch this before deploying? 🧐 It's the one I described here, which reproduces the updown.io monitoring workload: Sidekiq workers running http/https/tcp/icmp checks against local endpoints, and saving the results in MongoDB. Digging into it, I found a couple of problems with my setup:
- It was too short: 40k jobs, and the difference only starts to show after that.
- The benchmark itself was leaking: the worker ran with
Sidekiq.testing!(:fake)from the test environment config, so every job pushed by another job (SSL checks, IPv6 detection, etc.) piled up in an in-memory fake queue forever. This inflated the memory growth everywhere, and at first made me think 3.4 was affected too.
Once fixed, I ran 300k jobs on one worker with each Ruby version:
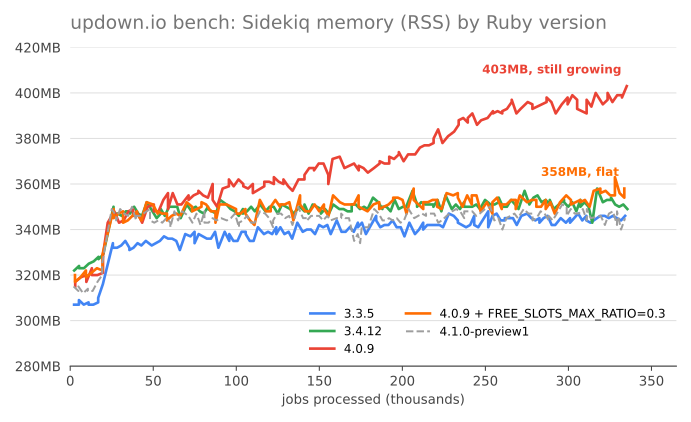
There it is ✅ 3.3.5 and 3.4.12 stay flat at ~345MB after the warm-up, while 4.0.9 keeps growing in a "straight" line, up to 403MB at the end of the run (and still going). I also tried 4.0.9 with YJIT disabled: it grows just the same, so it's not YJIT.
4. Leak or not leak? 🕵️♂️
To understand where this memory goes, I loaded a small script in the Sidekiq worker logging GC.stat every 10 seconds. No need to touch the app code for this, RUBYOPT can load it in any process:
# RUBYOPT="-r./gc_stats.rb" bundle exec sidekiq
if File.basename($0) == 'sidekiq'
  Thread.new do
    loop do
      sleep 10
      rss = File.read('/proc/self/status')[/VmRSS:\s+(\d+)/, 1].to_i / 1024
      s = GC.stat
      STDERR.puts "rss=#{rss}MB pages=#{s[:heap_allocated_pages]} old_objects=#{s[:old_objects]} " \
                  "minor_gc=#{s[:minor_gc_count]} major_gc=#{s[:major_gc_count]}"
    end
  end
end
The two interesting numbers here are:
old_objects: the objects which survived several GCs. If my code (or a gem) was keeping references to objects (a real leak), this would grow.heap_allocated_pages: the number of 64KB pages in the Ruby heap, where the objects are stored.
| Ruby (300k jobs) | RSS at the end | Heap pages | old_objects | Jobs/s |
|---|---|---|---|---|
| 3.3.5 | 346 MB | 737 → 750 | 593k → 611k | 232 |
| 3.4.12 | 349 MB | 955 → 962 | 578k → 621k | 233 |
| 4.0.9 | 403 MB 📈 | 782 → 1,266 | 606k → 583k | 268 🚀 |
So it's not a leak: the number of old objects is stable (it even goes down a bit on 4.0). But the heap of 4.0 keeps growing, with more and more empty space which is never given back.
Also note how many minor GCs each version runs for the same work: 17.9k for 3.3.5, 11.9k for 3.4.12 and only 6.4k for 4.0.9. Running fewer GCs is probably part of why 4.0 is faster, the counterpart being that it relies on a bigger heap.
5. 🧹 Let's tune the GC
Ruby has a few environment variables to tune the GC heap, so let's try them on 4.0.9:
| Setting (4.0.9, 300k jobs) | Default | RSS at the end | Heap pages | Minor GCs | Jobs/s |
|---|---|---|---|---|---|
| none | 403 MB 📈 | 1,266 | 6.4k | 268 | |
RUBY_GC_HEAP_GROWTH_FACTOR=1.1 |
1.8 | 400 MB 📈 | 1,287 | 4.9k | 264 |
RUBY_GC_HEAP_FREE_SLOTS_MIN_RATIO=0.1 |
0.2 | 416 MB 📈 | 1,467 | 6.2k | 265 |
RUBY_GC_HEAP_GROWTH_MAX_SLOTS=20000 |
0 (no limit) | 367 MB | 973 | 8.8k | 265 |
RUBY_GC_HEAP_FREE_SLOTS_MAX_RATIO=0.3 |
0.65 | 358 MB, flat ✅ | 852 | 11.1k | 264 |
GROWTH_FACTOR + MIN_RATIO + MAX_RATIO |
351 MB | 837 | 15k | 265 |
🎉 RUBY_GC_HEAP_FREE_SLOTS_MAX_RATIO=0.3 keeps the memory flat, close to the 3.4 level, with no measurable slowdown (264 vs 268 jobs/s, within the noise). It runs almost twice as many minor GCs, but that's still fewer than 3.4, and 4.0 stays faster. The other settings either don't help or help less, and combining them only adds more GCs. I also tried GC.auto_compact = true and RUBY_GC_HEAP_OLDOBJECT_LIMIT_FACTOR, without much effect.
6. What about Ruby 4.1? 🔮
4.1.0-preview1 came out recently so I tried it too: memory stays flat with the default settings (~345MB, ~900 heap pages). The GC was rework a lot (the C file grew from 9.6k to 13.5k lines) so I did not investigate why ^^. As 4.1 seems to fix it already, I didn't open an issue, but if someone knows which change fixed it, it may be worth a backport to 4.0.
The preview was also 18% slower in my benchmark (220 jobs/s vs 268 for 4.0.9), but it's a preview so I wouldn't read too much into it. I'll benchmark again when 4.1.0 is released.
7. The fix in production ✅
I use foreman to export my Procfile to systemd units, and it reads the .env file at the root of the app, so all I had to do was add this:
# .env
# Ruby 4.0 keeps growing the heap (pages) without releasing free ones (default 0.65)
# Not needed on Ruby 4.1: remove when upgrading after checking memory
RUBY_GC_HEAP_FREE_SLOTS_MAX_RATIO=0.3
It's been running in production since November 20th (the green part on the first chart). Comparing the memory growth from 2h to 17h after a restart, averaged over the 9 servers:
| Ruby | Memory growth per server |
|---|---|
| 3.3.5 | +0.25 GB |
| 4.0.9 | +0.69 GB 📈 |
4.0.9 + FREE_SLOTS_MAX_RATIO=0.3 |
+0.25 GB ✅ |
Back to the Ruby 3.3 level 🎉 And the average CPU usage of the servers went from 39.4% on Ruby 3.3 to 37.2% on 4.0, and 36.9% with the fix, so it doesn't cost anything visible in production. The gain is smaller than the 15% of the benchmark, because these servers spend more part of their time outside of Ruby (curl, OpenSSL, Redis, memcached, etc.).
👨💻 Protip: if you upgrade to Ruby 4.0 and see the memory of your long-running processes (Sidekiq, Puma, ...) slowly growing, compare heap_allocated_pages and old_objects in GC.stat over time. If the pages grow but not the old objects, it's probably this, and RUBY_GC_HEAP_FREE_SLOTS_MAX_RATIO=0.3 may be your one-line fix.

Comments
Sign in to comment